Knowledge Base
Thoughts on the investment process.
Asset Allocation
Guidelines for understanding investing and asset allocation.
Understand the difference between investing and speculating
Investing
- You hold a long term position in an asset with no attempt to time your investment or to predict the return
- You have a diversified balanced portfolio to smooth the volatility of asset prices across the business cycle
- Your savings are in a bank account or a liquid money market fund
Speculating
- You select individual line items within an asset class as you believe they will do better than the market as a whole
- You move your capital in and out of assets classes depending upon how you think they will perform in the near future
- You base your allocations upon:
- Fundamental Analysis
- Technical Analysis
- Cyclical Analysis
- Economic Analysis
We are not saying Speculating is bad versus Investing. But you should be clear about what percentage of your portfolio is in "Investment" and what percentage is in "Speculation"
An Investment Portfolio
- Keep it simple
- Smooth out the volatility across the business cycle
- Spread the risk (diversification)
- Keep some assets outside your own country
- Buy and hold, with only infrequent rebalancing
- Long term tax planning
A Speculative Portfolio
- Only speculate with money you can afford to lose
- Investment experts / systems are NOT riskless
- The future is undetermined thus impossible to predict, no future is inevitable
- Track records are of little statistical significance
- System owners should be very very wealthy
An investment portfolio
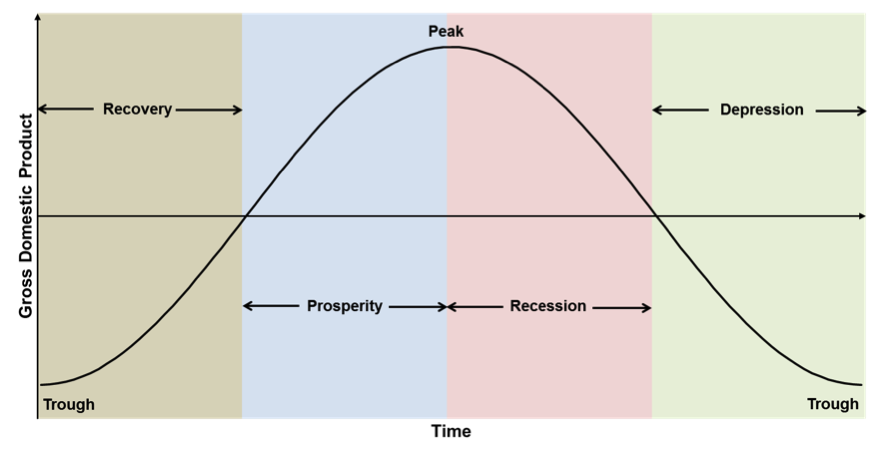
Four phases of the business cycle
| Output | Income | Employment | Prices and Profits | Business Optimism | Investment | Bank Credit | |
|---|---|---|---|---|---|---|---|
| Recovery | Steady Rise | Steady Rise | Steady Rise | Steady Rise | Steady Rise | Steady Rise | Steady Rise |
| Prosperity | High Level | High Level | High Level | High Level | High Level | High Level | High Level |
| Recession | Decline | Decline | Decline | Decline | Decline | Decline | Decline |
| Depression | Continuous Decline | Continuous Decline | Continuous Decline | Continuous Decline | Continuous Decline | Continuous Decline | Continuous Decline |
Constructing an efficient portfolio
The diagram below shows a historical asset class performance from 1940 to present day, using US data.
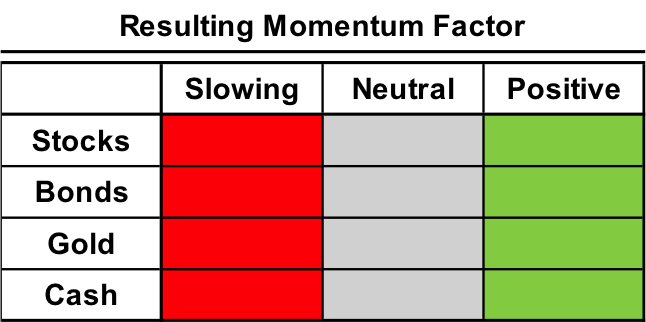
Applying momentum to the portfolio
- Asset markets are not ONLY influenced by Macro / Fundamental factors
- The system is a "Voting Machine" with each investor effecting the price
- Momentum takes into account the way investors are voting
- Momentum is a market anomaly that modern portfolio theory says should not exist
Technical Analysis can be applied to market price and volume data to examine the trend in the "voting machine" studies include:
- Price and Volume
- Moving Averages
- Regressions
- Business Cycles
- Chart Patterns
- Asset Correlations
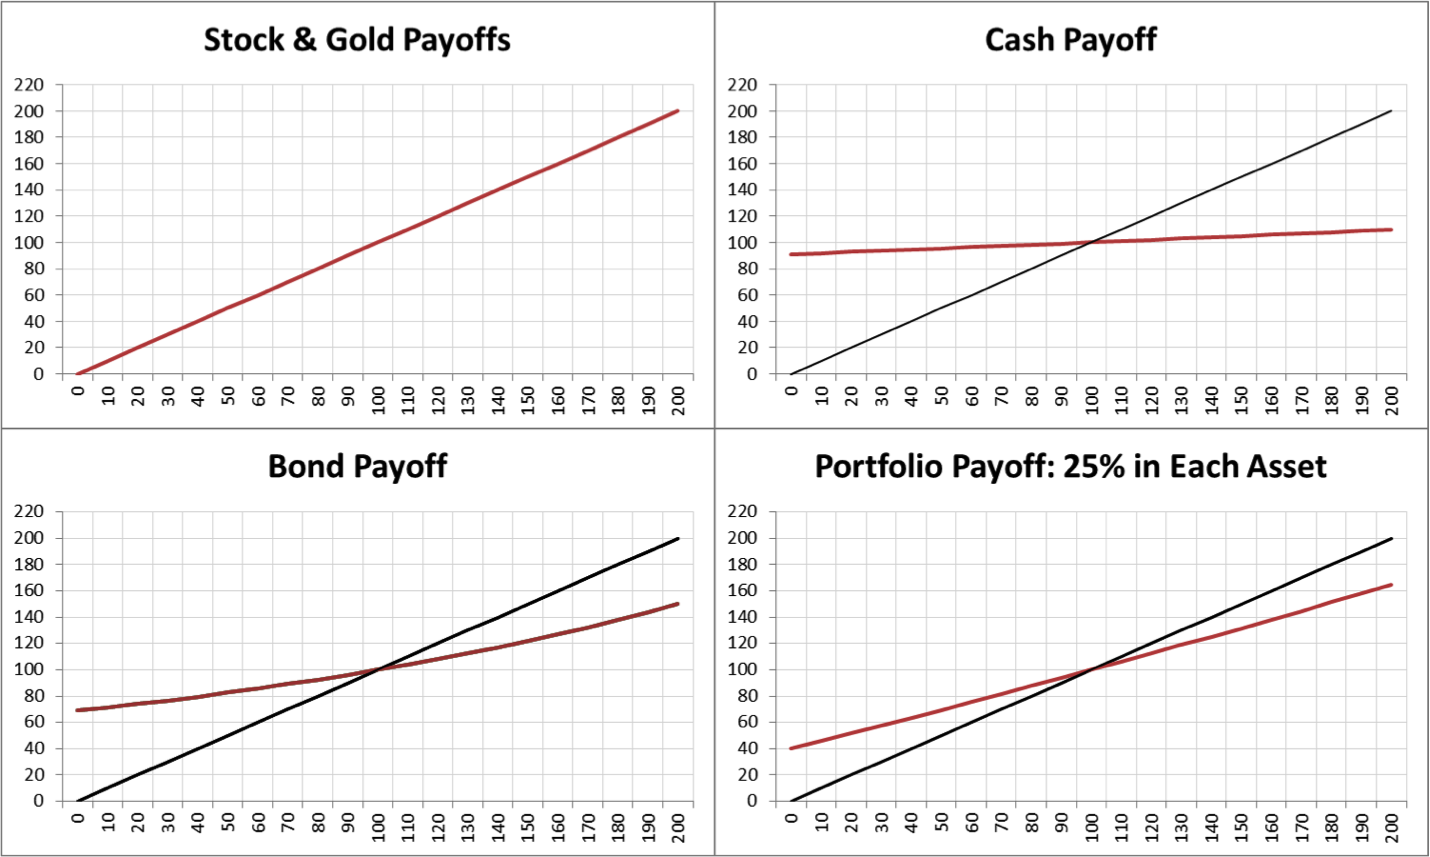
Diversification - Spreading the risk
By creating a portfolio with more than one asset the risk is spread out and the concentration reduced.
Chose assets in the portfolio that are uncorrelated, this should reduce the risk of the portfolio have a large loss.
If the payoff for each of the assets in the portfolio is different then again the risk of having a large loss is reduced.
This process is known as "Diversification".
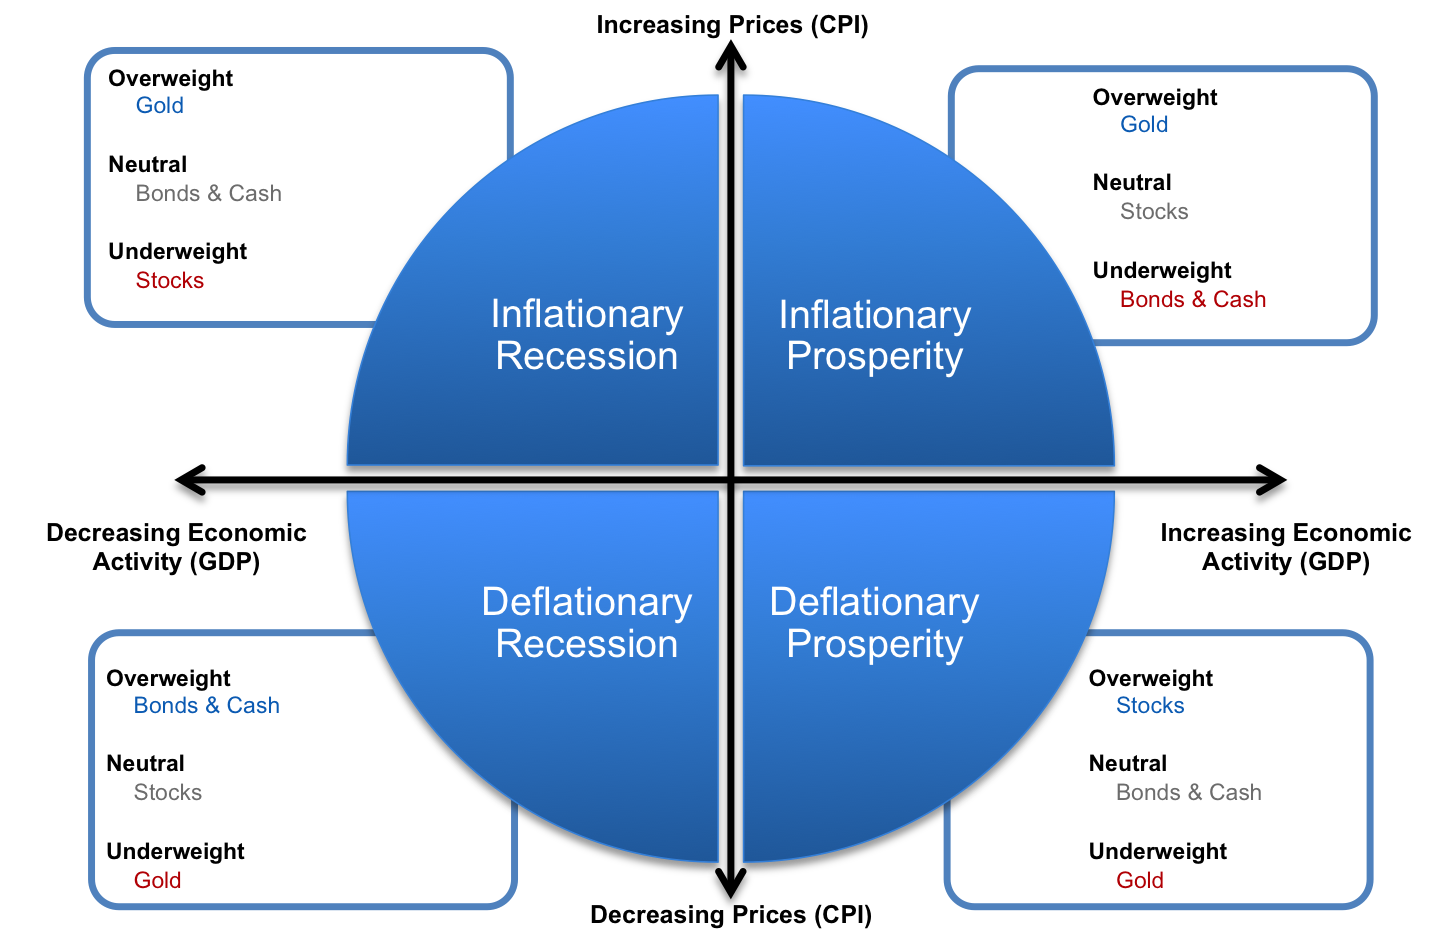
Ideally you would like a portfolio that performs well in each quadrant of the business cycle. To achieve this investors should chose assets that have different payoff profiles and perform differently in each business cycle.
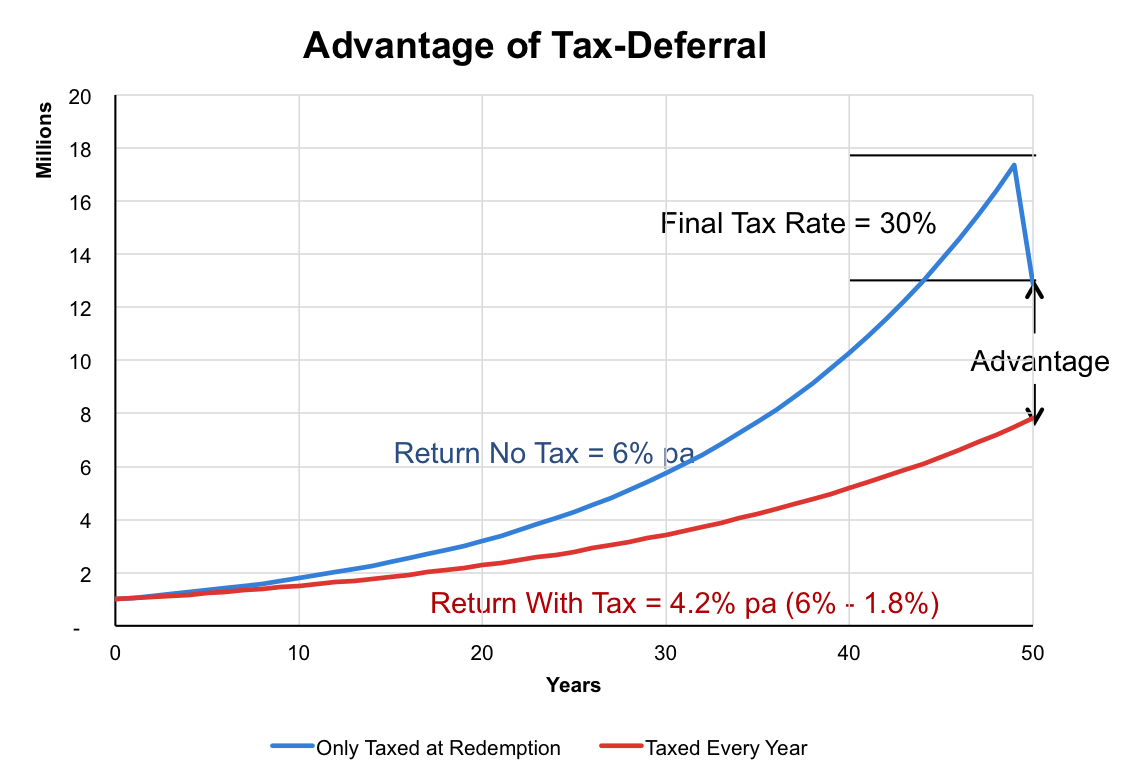
long term tax planning
Tax Deferral
Assuming the investment portfolio produces positive returns paying tax on the end lump sum is more efficient, the compound growth on the untaxed gains outweighs the tax bill at the redemption of the portfolio
Chart Assumes: Annual Returns of 6%; Annual Tax Rate of 30%; Final Tax Rate of 30%
Keeping it simple and liquid - ETF’s
Equities
- Large cap: SPY US; US$; SPDR® S&P 500® ETF; 9.5bps
- Small cap: SLYV US; US$; SPDR® S&P® 600 Small Cap Value ETF; 25 cap
- Non US International Equities (Including EM)
- EM: SMEA LN; iShares MSCI Emerging Markets (Acc); 75bps
- UK: ISF LN; iShares FTSE 100; 40bps & EURO: EUE LN; iShares EURO STOXX 50; 35bps
- Or just one ETF: CWI US; SPDR® MSCI ACWI ex-US ETF; 34bps
Fixed Income
- IG-EUR: IEAC LN; iShares Barclays Euro Corporate Bond; 20bps; YTM 2.05; Duration 4.6yrs; Holdings 1356
- IG-USD: LAG US; iShares Markit iBoxx $ Corporate Bond; 20bps; YTM 2.1; Duration 5.3yrs; Holdings 8,413
- HY-USD: HYLD LN; SPDR® Barclays Aggregate Bond ETF; 23bps; YTM 5.58%; Duration 4.6yrs; Holdings 755
Gold / Commodities
- Gold: GLD US; SPDR® Gold Shares; 40bps
- Commodities inc Gold: SDYC LN; iShares S&P GSCI Dynamic Roll Commodity Swap; 45bps (Precious Metals 3.6%)
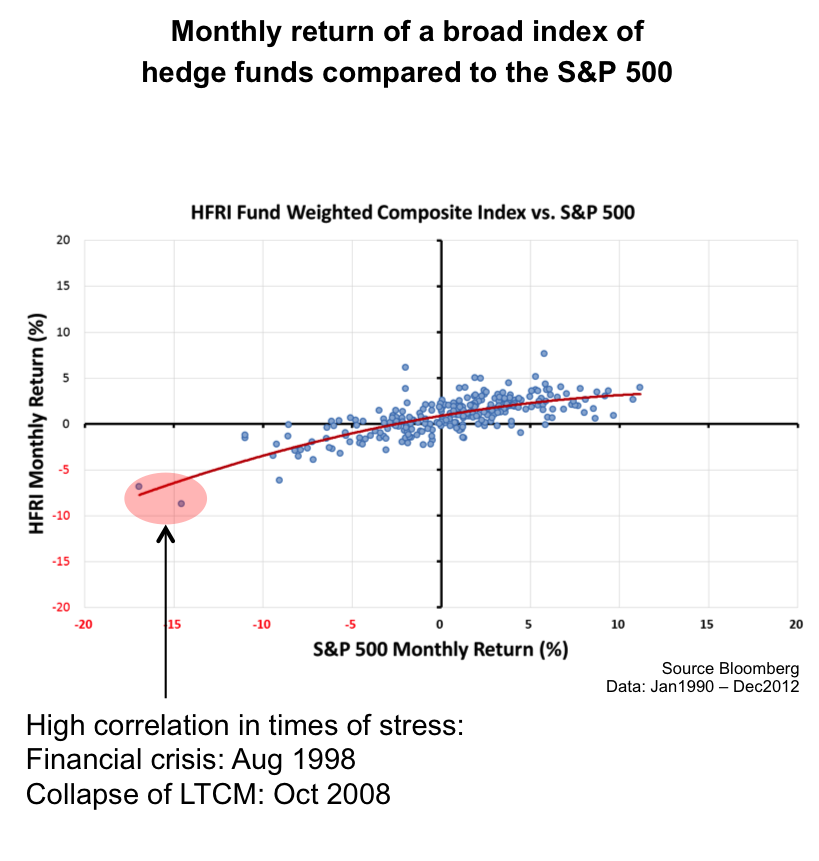
Our thoughts on “Alternative” investments
- Hedge funds generally have a concave profile
- Losing more in down markets than they make in up markets, as shown by red line on chart
- As hedge funds are trying to make money, this makes sense as convex profiles are expensive, thus it is not a surprise to see a concave profile
- The hedge funds are selling convex profiles to generate income
- The profile shows that returns become correlated in times of stress, exactly the time the investor needs the protection that does not exist!
- We suggest that this profile can be replicated by a simple rolling short dated downside put writing strategy, with similar risks and lower fees
- “Alternative” sources of return turn out, in aggregate (Individual funds and strategies certainly vary greatly), to be simply another way to take equity market downside risk